


Next: Few other plotting commands
Up: Plotting
Previous: Plot function
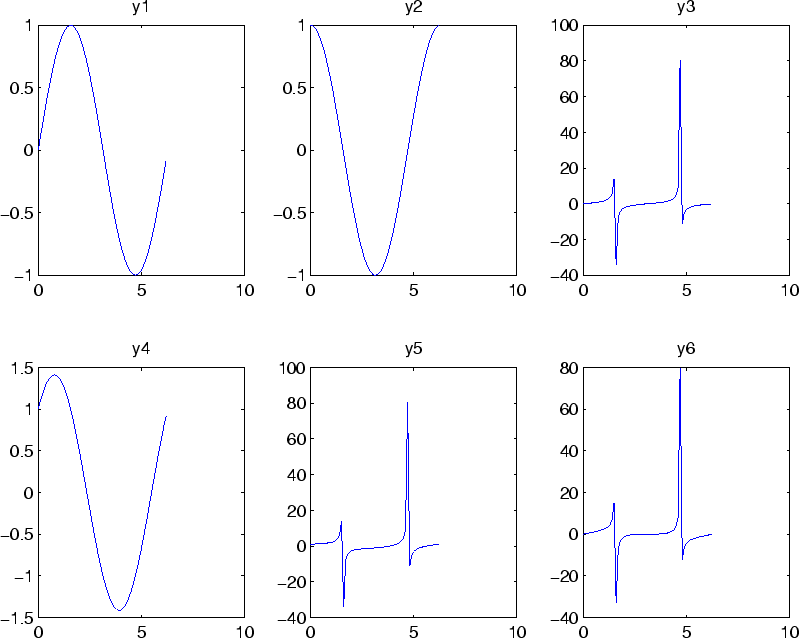
You can place multiple plots on the same figure using the subplot(m,n,p) command. m specifies how many rows you will have, n is the number of columns, and p is where you want to place the figure in this m x n matrix.
>> t=0:0.1:2*pi;
>> y1=sin(t);
>> y2=cos(t);
>> y3=tan(t);
>> y4=y1+y2;
>> y5=y2+y3;
>> y6=y1+y3;
>> subplot(2,3,1)
>> plot(t,y1)
>> title('y1')
>> subplot(2,3,2)
>> plot(t,y2)
>> title('y2')
>> subplot(2,3,3)
>> plot(t,y3)
>> title('y3')
>> subplot(2,3,4)
>> plot(t,y4)
>> title('y4')
>> subplot(2,3,5)
>> plot(t,y5)
>> title('y5')
>> subplot(2,3,6)
>> plot(t,y6)
>> title('y6')
Figure 3:
subplot example
 |
Copyright © 2004, Aly El-Osery
Last Modified 2005-10-27