-
Turn on the oscilloscope with the button in the upper right corner.
Attach a BNC to alligator cable to the Channel 1 BNC input
connector.
-
On the oscilloscope, set the following controls:
Channel 1 Volts / Division = 2 (The CH 1 button enables/disables the channel, turn VOLTS/DIV knob).
Time / Division = 200us (Turn SECONDS/DIV knob).
Trigger Source = Channel 1 (select Channel 1 from the Trigger Source menu).
-
Turn on the function generator. Attach another BNC to alligator cable to
the output connector (be careful not to attach it to the Sync (TTL)
output). Attach the red alligator clips from both cables together. Repeat
with the black clips.
-
You will now configure the function generator to output a 8Vpp (peak-to-peak),
1 Khz sinusoidal wave.
- Use the function keys to select the sinusoidal wave pattern.- Use frequency and range controls to set the output frequency to 1 Khz.
- Use the amplitude control and the display on the oscilloscope to set the output
amplitude to 8 volts peak to peak.
-
You should now see a sinusoidal wave on the oscilloscope. If not, then ask
a lab assistant for help. The problem may be with some oscilloscope settings,
some function generator settings, or the physcial connection.
-
Now, make sure the sinusoidal wave is vertically centered on your scope.
Use the channel 1 ground switch and the channel 1 vertical position control.
- Since the cosine wave is the standard for sinusoidal wave patterns, adjust the horizontal position of the wave so that the positive peak amplitude intercepts the vertical axis. This can be done by highlighting horizontal position with the "selector" and then adjusting the position with the variables control.
You should now have a stable cosine wave with an amplitude of 4volts, a phase
shift of 0 degrees, and a frequency of 1 Khz (see equation 1) displayed on
the oscilloscope. Have a lab TA verify this.
The oscilloscopes are equipped with a set of horizontal and vertical
cursors to aid in obtaining measurements. You can use these to measure various
parameters like peak voltage, period, and frequency.
-
Measure the Peak-to-Peak amplitude of the waveform using the
horozontal cursors. To do this, use "selector" to highlight measure. Then
use thevariables knob to set one cursor at a minimum of the cosine wave.
Push the cursor botton down until the other cursor is seleted and use
the variables knob to set this cursor to a maximum of the cosine wave. The
oscilloscope will display the voltage difference between the two
cursors.
-
Measure the Period of the waveform using the vertical cursors.
To do this, use the selector switch to display vertical cursors. Set
the cursors to measure the period of one cycle of your waveform as you did
in part "a". The display should show the period of the cosine wave.
-
What is the frequency of the waveform in hertz? What is Vp?
-
Now, we will adjust the function generator to output the waveform in equation
2. Start bringing up the frequency from 1 Khz to the value you calculated
in part a, and notice what happens to the waveform displayed on the oscilloscope.
Rreadjust the sec/div knob on the scope until one or two periods take up
most of the the screen. What happens to the signal displayed on the
scope as the frequency from the function generator gets higher?
-
With the cursors, measure Vp (peak) and Vpp (peak-to-peak) and record these
values in your lab book.
-
With the cursors, measure the frequency of the waveform and record this value
in your lab book.
-
Sketch the waveform as best as you can in your lab book.
NOTE: You do not have to use the protoboard's power supply for this
circuit. The function generator is providing the voltage source.
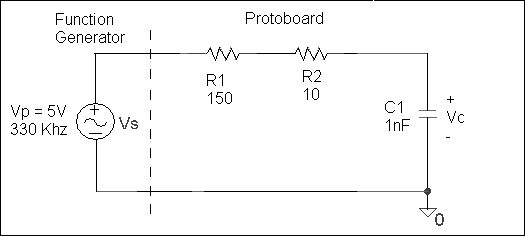
Figure 1.
You will need another BNC to alligator connector to use for measuring on Channel 2 of the oscilloscope. Hook up the Oscilloscope's Channel 1 and the Function Generators red alligator clips together. This node is the positive voltage supply. Hook up all 3 black alligator clips together. This mode is the ground node. Essentially, Channel 1 will be measuring Vs, and Channel 2 will be measuring Vc.
On your oscilloscope, display both the Vs and Vc signals simultaneously.
To do this, press the "dual " button on the oscilloscope. Also, set the ground
reference (by vertically centering both signals like part 1f).
-
Once the Vs and Vc waveforms are properly displayed, use the vertical cursors
to measure the frequency and period of each wave. Note that each waveform
has the same frequency and period. Then, using your input waveform
as the reference, measure the time difference between it and the output waveform.
This time delay is the tmax value that you have been introduced to in
class. Convert this value to degrees using equation 3 and write
a sinusoidal formula for Vc based on the information you've gathered in this
step.
tmax = -phase * T / 360 (3)
- Sketch and fully label (axes labels, tmax point, Vp, -Vp, and the period) the two waveforms in your lab book, on the same graph.