Lab 3: Square Waves and RC Time Constants
The purpose of this lab is to measure the step and square wave response of an RC circuit.
1. First, we will learn how to use the oscilloscope to observe and measure rise times and fall times. Set the frequency of your function generator to about 10 Hz and display a square wave and then a triangle wave from your function generator. Note and sketch any difference when the scope input is a.c. or d.c. coupled. Explain why the signal is degraded on a.c. coupling? Use d.c. coupling for the rest of this lab.
2. Set the frequency to 1 MHz. Measure the risetime of the square wave (the time it takes to go from 10 % to 90 % of its final value) by expanding the time base.
3. Oscilloscopes are many times used with special probes. A standard one is a passive times 10 (X10) probe. We do not need this type of probe for the EE 212 laboratory, but it would be to your advantage to understand their properties and proper use. Do some research before coming to lab and then answer the following questions with regard to a passive times 10 probe:
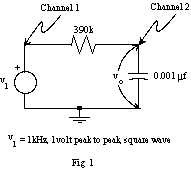
4. Construct the RC circuit shown in Figure 1 on your breadboard. Use your function generator to generate the 1kHz square wave. Display both the input and output on the scope. Make sure the time base is calibrated. Trigger on the leading edge of the input.
What is the theoretical time constant "tau" of this circuit? Plot the output waveforms of a single period for the input periods T = 10 "tau", "tau", and 0.1 "tau". Label your axes. Explain the form of these plots.

5. For T = 10 "tau", the initial part of the waveform is the step response of the circuit. Calculate (before coming to lab) the relationship between the 10-90% rise time and the time constant "tau". Use this relationship to determine the time constant of this circuit by measuring its 10-90% risetime. Compare with the theoretical time constant.
For which pulse length does the output most resemble the input?
6. Repeat parts 5-6 with the R and C interchanged. Sketch the circuit. Plot the waveforms as the input period is varied. Answer the following questions:
How can the output voltage sometimes be greater than the input?
Which of your above plots represents the step response of the circuit?
What is the response to a short pulse? Why isn't the output amplitude constant?