 Figure 1
End of Prelab
Now that you have a TTL compatible square wave source operating between about 1Hz and 10Hz (last week's lab) the folks in marketing want an enhanced model with selectable frequency ranges up to 100kHz. (Marketers rarely know how hard it is to bang this stuff out). Using the existing 555 based signal source you designed in lab 6, calculate new values for capacitor C1 (do not change any other components) to provide the following output frequency ranges:
Recall that your 555 output frequency is determined by the formula:
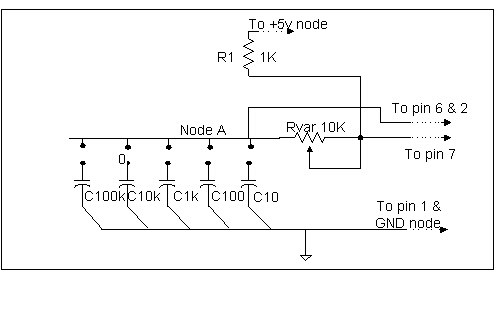
Assume you are using the same 1 KΩ resistor for R1 and the same 10 KΩ potentiometer for Rvar (called R4 last week) that you designed for last week. Also assume that you are still using the 150 uF capacitor for the 1 Hz to 10 Hz range.
Here's how: If we need ten times the frequency on the left side of the equation, we need to determine how to alter the right side of the equation to make that possible. Figure out how to scale the capacitor value and use that to scale the 150 uF capacitor to other values. You should find that to change frequency range by a power of ten, you need to change the capacitor value by a power of a tenth (Because the C1 value is in the denominator).
Here's how: For each frequency range, to determine the minimum and maximum frequency within the range, change the value of Rvar *not* the value of C1. Then change C1 to switch to the next frequency range and recalculate the min and max f. Remember that we accepted some error in the final frequency output to accomodate the parts we chose to use.
Figure 1
End of Prelab
In this lab exercise you will complete the second stage of your EE101 semester project. Be sure to write up this lab thoroughly because you will need it to write your formal report.
Today you will build and test the 555 square wave source you designed during this pre-lab and the previous lab. As stated in the pre-lab, your function generator should cover the frequency range from 1 Hz to 1 MHz by utilizing all the capacitors determined in the prelab calculations. A sample schematic for the capacitor bank was provided in Figure 1. You are not required to build a capacitor bank as the caps can be easily switched out instead. If you would like to build a bank, the connections between node A and the various capacitors can be realized with a piece of jumper wire between the pot and the capacitor of choice.
Part I - Build the circuit
It is important to work off the actual schematic diagram from last week's p-spice simulation when you build this circuit. We want to build the exact circuit you simulated, so be sure you're using the same diagram from the p-spice file that you simulated. If you opted to add the correction resistor to control the max value of the potentiometer (last week's extra credit portion), be sure to use it in this lab too. Your instructor can help you find the exact value of resistor that you calculated.
Get a 555 timer chip and the capacitors and resistors you chose for your design and build the circuit on a proto-board. Try to keep your wiring under control and avoid the 'spagehtti board' effect. (There is no need to include all the frequency control capacitors in your circuit at one time.) Start with the 150 uF capacitor so we can test the 1 to 10 Hz range first, then switch to each of the other capacitors for the remaining ranges. Use as few wires as possible, make them as short as possible, and take advantage of the red and blue Vcc and Ground bus lines provided on the breadboard.
Part II - Function Test Using Oscilloscope
To test the function of your circuit, we will use an oscilloscope to measure the frequency ranges given when each capacitor value is used.
Before proceding, have a TA check to see that your circuit is safely wired BEFORE turning on the power supply.
Copyright 2001-2010, New Mexico Tech