% m-file name: example3.m
% description: plots sinusoids for phase (lead/lag) comparison
clear; clf;
w = 8;
T = 2*pi/w;
t = linspace(0,2*T,250);
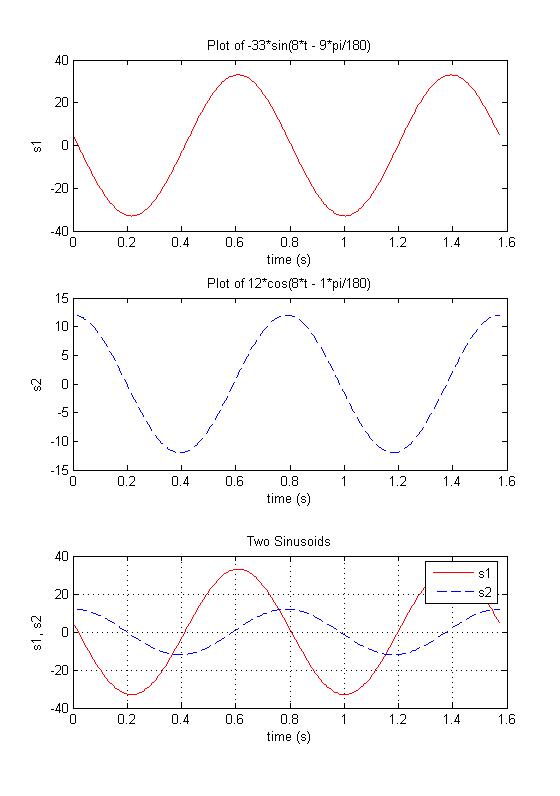
s1 = -33*sin(8*t - 9*pi/180);
s2 = 12*cos(8*t - 1*pi/180);
subplot(3,1,1)
plot(t,s1,'r')
xlabel('time (s)'); ylabel('s1'); title('Plot of -33*sin(8*t - 9*pi/180)');
subplot(3,1,2)
plot(t,s2,'b--')
xlabel('time (s)'); ylabel('s2'); title('Plot of 12*cos(8*t - 1*pi/180)');
subplot(3,1,3)
plot(t,s1,'r')
hold
plot(t,s2,'b--')
hold
grid
xlabel('time (s)')
ylabel('s1, s2')
title('Two Sinusoids')
legend('s1', 's2')
After changing Matlab's Current Directory to where m-file is saved:
>> example3
Figure/Plot Generated: