EE 212L: Frequency Response of Circuits
Objective: The purpose of this lab is to experimentally construct and verify the frequency responses of two circuits. The circuits to be studied are the passive RLC circuit shown in Figure 1 and the active network shown in Figure 2.
Pre-lab:
- Determine the transfer function Vo(jω)/Vi(jω) for the circuits shown in Figures 1 and 2 below.
- Plot the frequency responses (magnitude and phase using a
computer-based tool such as Matlab) for these circuits keeping in
mind:
- linear and/or logarithmic axes may be used as may Decibels (dB), so choose which will be easiest to replicate and verify experimentally (i.e., you will be experimentally constructing these same plots);
- ensure key regions are readily visable for meaningful comparison with experimental results; and
- the frequency responses may be significantly affected by the internal resistance of the function generator and/or impedance of the oscillocope probe, so include their effects as warranted.
Laboratory Procedure:
- Frequency Response of an RLC Circuit
- Construct the circuit shown in Figure 1.
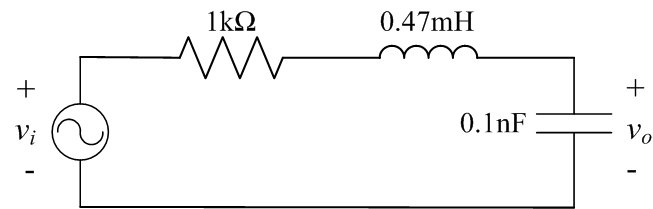
Figure 1: Series RLC circuit - Let vi(t) be a 2 Vp-p sine wave for which you'll vary the frequency.
- Use your prelab results as a guide as to what frequency range should be used and experimentally find (via measurements) a table of values for the frequency response (magnitude and phase) of Vo(jω)/Vi(jω). Note the function generator and oscilloscope display frequency in Hertz and your plots are likely versus frequency in rad/sec, so make sure to convert in whichever way you choose to keep the units consistent. Take extra points in regions where the magnitude or phase change quickly.
- Compare your results with the calculated values plotted in the prelab by recording the experimental data on top of the calculated prelab data/plots.
- How would one describe this circuit?
- Does this passive circuit ever yield a gain larger than 1 (0dB)? If so, how is this possible?
- Construct the circuit shown in Figure 1.
- Frequency Response of an Active Circuit
- Construct the circuit shown in Figure 2.
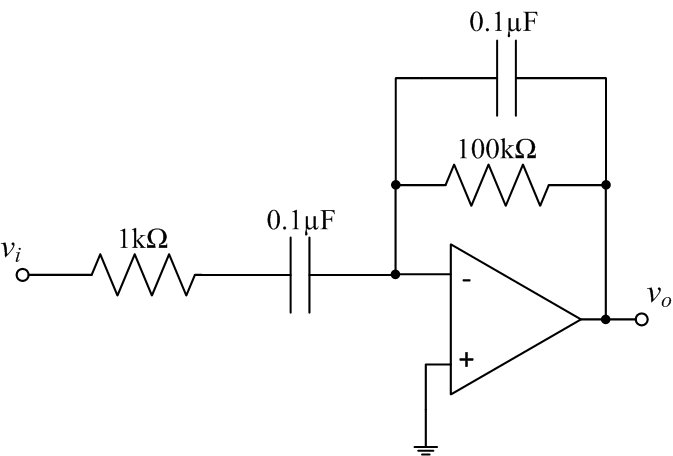
Figure 2: Active (op-amp-based) circuit - Let vi(t) be a 2 Vp-p sine wave for which you'll vary the frequency.
- Use your prelab results as a guide as to what frequency range should be used and experimentally find (via measurements) a table of values for the frequency response (magnitude and phase) of Vo(jω)/Vi(jω). Note the function generator and oscilloscope display frequency in Hertz and your plots are likely versus frequency in rad/sec, so make sure to convert in whichever way you choose to keep the units consistent. Take extra points in regions where the magnitude or phase change quickly.
- Compare your results with the calculated values plotted in the prelab by recording the experimental data on top of the calculated prelab data/plots.
- How would one describe this circuit?
- Construct the circuit shown in Figure 2.
Revised MAR2015