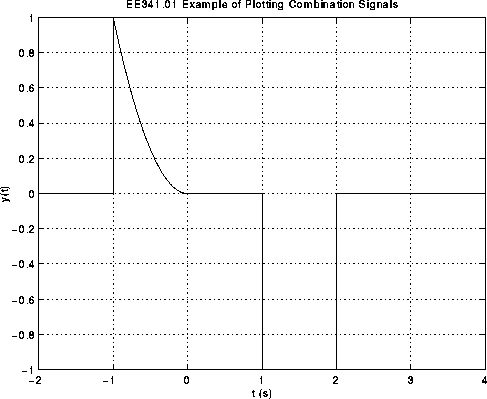
This example shows a MATLAB M-file for plotting a signal composed of various functions on various intervals.
MATLAB M-File example4.m:
%
% M-File Name: example4.m
%
% Description:  This M-File plots a signal that is a combination
%               of various functions. The function to be plotted is:
%
%               y(t)=t^2 u(t+1) - t^2 u(t) - u(t-1) + u(t-2)
%

ta = [-2 -1];
ya = [ 0  0];
tb = -1:0.01:0;
yb = tb.^2;
tc = [0 1];
yc = [0 0];
td = [ 1  2];
yd = [-1 -1];
te = [2 4];
ye = [0 0];

t = [ta tb tc td te];
y = [ya yb yc yd ye];
plot(t,y)
xlabel('t (s)')
ylabel('y(t)')
title('EE341.01 Example of Plotting Combination Signals')
grid
Run example4.m by typing example4 at the prompt after
saving example4.m in your working directory.
MATLAB Plot Generated:
