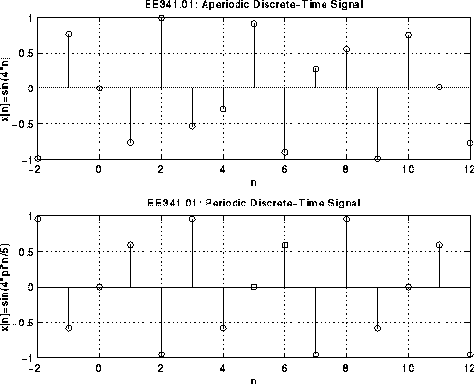
This example shows a MATLAB M-file for plotting an aperiodic discrete-time signal and a periodic discrete-time signal.
MATLAB M-File example5.m:
%
% M-File Name: example5.m
%
% Description: This M-file plots two discrete-time
%              sinusoids to demonstrate discrete-time
%              periodic funtions.
%

n = -2:12;             % define n values in a vector
x1 = sin(4*n);         % define x1[n]=sin(4*n)
x2 = sin(4*pi*n/5);    % define x2[n]=sin(4*pi*n/5)

subplot(2,1,1)         % plot and label first signal
stem(n,x1)
grid
xlabel('n')
ylabel('x[n]=sin(4*n)')
title('EE341.01: Aperiodic Discrete-Time Signal')

subplot(2,1,2)         % plot and label second signal
stem(n,x2)
grid
xlabel('n')
ylabel('x[n]=sin(4*pi*n/5)')
title('EE341.01: Periodic Discrete-Time Signal')
MATLAB Plot Generated: