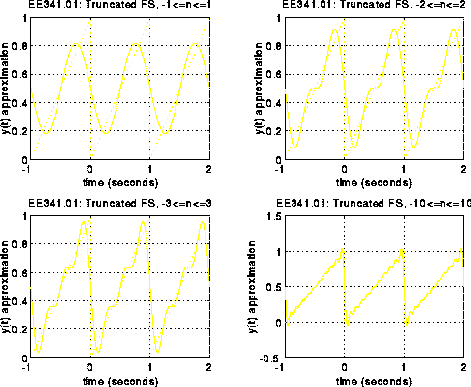
This example shows a MATLAB M-file for plotting a truncated Fourier Series. Various numbers of terms are used.
MATLAB M-File example7.m:
%
% Filename: example7.m
%
% Description: Example to show how the truncated Fourier series in
%              complex exponential form approximates the real
%              signal.  More and more terms are taken showing a
%              better and better representation of the original signal.
%

clear;                   % clear all variables
clf;                     % clear all figures

% Define parameters to plot original sawtooth

tr = [-1 0 0 1 1 2 2];
yr = [0 1 0 1 0 1 0];

% Plot Truncated Fourier Series Approximation (N = 1)

N = 1;                   % define number of terms to use (n = -N..N)
wo = 2*pi;               % define fundamental frequency
c0 = 0.5;                % define dc bias coefficient
t = -1:0.001:2;          % define time values for y(t)
y = c0 * ones(size(t));  % let initial y = c0 (dc bias) for all times

for n = -N:-1,           % compute y for negative n
  cn = (1/(n*n*wo*wo))*(exp(-j*n*wo)+j*n*wo*exp(-j*n*wo)-1);
  y = y + real(cn * exp(j*n*wo*t));
end;
                         % compute y for positive n and add to y
for n = 1:N,             % found using negative n
  cn = (1/(n*n*wo*wo))*(exp(-j*n*wo)+j*n*wo*exp(-j*n*wo)-1);
  y = y + real(cn * exp(j*n*wo*t));
end;

subplot(2,2,1);          % plot approximation
plot(t,y);
hold;
plot(tr,yr,':');
hold;
grid;
xlabel('time (seconds)');
ylabel('y(t) approximation');
title('EE341.01: Truncated FS, -1<=n<=1');

% Plot Truncated Fourier Series Approximation (N = 2)

N = 2;                   % define number of terms to use (n = -N..N)
wo = 2*pi;               % define fundamental frequency
c0 = 0.5;                % define dc bias coefficient
t = -1:0.001:2;          % define time values for y(t)
y = c0 * ones(size(t));  % let initial y = c0 (dc bias) for all times

for n = -N:-1,           % compute y for negative n
  cn = (1/(n*n*wo*wo))*(exp(-j*n*wo)+j*n*wo*exp(-j*n*wo)-1);
  y = y + real(cn * exp(j*n*wo*t));
end;
                         % compute y for positive n and add to y
for n = 1:N,             % found using negative n
  cn = (1/(n*n*wo*wo))*(exp(-j*n*wo)+j*n*wo*exp(-j*n*wo)-1);
  y = y + real(cn * exp(j*n*wo*t));
end;

subplot(2,2,2);          % plot approximation
plot(t,y);
hold;
plot(tr,yr,':');
hold;
grid;
xlabel('time (seconds)');
ylabel('y(t) approximation');
title('EE341.01: Truncated FS, -2<=n<=2');

% Plot Truncated Fourier Series Approximation (N = 3)

N = 3;                   % define number of terms to use (n = -N..N)
wo = 2*pi;               % define fundamental frequency
c0 = 0.5;                % define dc bias coefficient
t = -1:0.001:2;          % define time values for y(t)
y = c0 * ones(size(t));  % let initial y = c0 (dc bias) for all times

for n = -N:-1,           % compute y for negative n
  cn = (1/(n*n*wo*wo))*(exp(-j*n*wo)+j*n*wo*exp(-j*n*wo)-1);
  y = y + real(cn * exp(j*n*wo*t));
end;
                         % compute y for positive n and add to y
for n = 1:N,             % found using negative n
  cn = (1/(n*n*wo*wo))*(exp(-j*n*wo)+j*n*wo*exp(-j*n*wo)-1);
  y = y + real(cn * exp(j*n*wo*t));
end;

subplot(2,2,3);          % plot approximation
plot(t,y);
hold;
plot(tr,yr,':');
hold;
grid;
xlabel('time (seconds)');
ylabel('y(t) approximation');
title('EE341.01: Truncated FS, -3<=n<=3');

% Plot Truncated Fourier Series Approximation (N = 10)

N = 10;                  % define number of terms to use (n = -N..N)
wo = 2*pi;               % define fundamental frequency
c0 = 0.5;                % define dc bias coefficient
t = -1:0.001:2;          % define time values for y(t)
y = c0 * ones(size(t));  % let initial y = c0 (dc bias) for all times

for n = -N:-1,           % compute y for negative n
  cn = (1/(n*n*wo*wo))*(exp(-j*n*wo)+j*n*wo*exp(-j*n*wo)-1);
  y = y + real(cn * exp(j*n*wo*t));
end;
                         % compute y for positive n and add to y
for n = 1:N,             % found using negative n
  cn = (1/(n*n*wo*wo))*(exp(-j*n*wo)+j*n*wo*exp(-j*n*wo)-1);
  y = y + real(cn * exp(j*n*wo*t));
end;

subplot(2,2,4);          % plot approximation
plot(t,y);
hold;
plot(tr,yr,':');
hold;
grid;
xlabel('time (seconds)');
ylabel('y(t) approximation');
title('EE341.01: Truncated FS, -10<=n<=10');
MATLAB Plot Generated:
