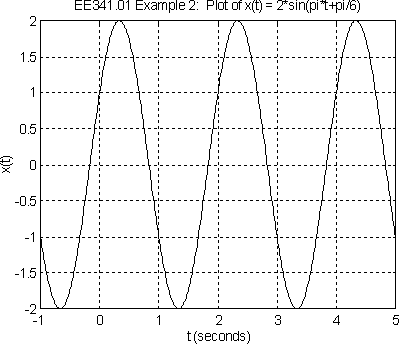
This example shows how a MATLAB m-file can be used to plot a sine wave. The m-file can be created in any text editor (e.g., emacs or notepad).
MATLAB M-File example2.m:
%
% File Name: example2.m
%
% Description: Matlab m-file for plotting a sine wave.
%

A = 2;                              % Define the amplitude
w = pi;                             % Define the frequency in Hertz
theta = pi/6;                       % Define phase shift
t = -1:0.01:5;                      % Define the time vector
x = A * sin(w * t + theta);         % Compute y(t), the sine wave
plot(t,x)                           % Plot y vs. t
xlabel('t (seconds)')               % Label x-axis
ylabel('x(t)')                      % Label y-axis
                                    % Give plot a title
title('EE341.01 Example 2:  Plot of x(t) = 2*sin(pi*t+pi/6)')
grid                                % Add grid to plot
Before running the m-file, make sure matlab looks in the
directory where the m-file is stored (C:\Myfiles in my case) by
using the change directory (cd) command:
>> cd C:\MyfilesRun example2.m by typing example2 at the prompt:
>>example2MATLAB Plot Generated:

The plot was printed by typing 'print' at the MATLAB prompt when the plot was displayed in the graphics window.