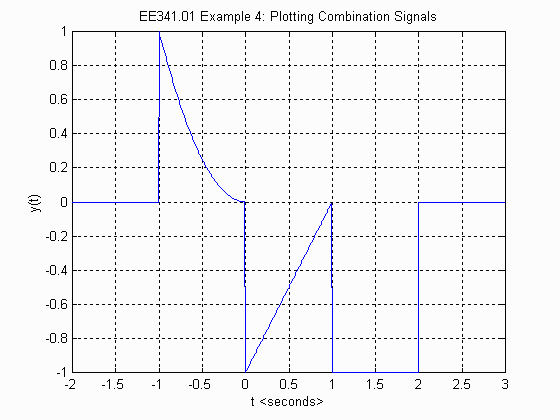
This example shows how a MATLAB m-file can be used to plot combination signals. The m-file can be created in any text editor (e.g., emacs, notepad, or matlab editor).
MATLAB M-File example4.m:
%
% File Name: example4.m
%
% Description:  This m-file demonstrates how to plot the combination signal
%               y(t)=t^2(u(t+1)-u(t))+(t-1)(u(t)-u(t-1))+(-1)(u(t-1)-u(t-2)).
%

clear; clf;

t = -2:0.01:3;
y = (t.*t).*((t>=-1)-(t>=0)) + (t-1).*((t>=0)-(t>=1)) + (-1)*((t>=1)-(t>=2));
plot(t,y);
grid;
xlabel('t ');
ylabel('y(t)');
title('EE341.01 Example 4: Plotting Combination Signals');
Before running the m-file, make sure matlab looks in the
directory where the m-file is stored (C:\Myfiles in my case) by
using the change directory (cd) command:
>> cd C:\MyfilesRun example4.m by typing example4 at the prompt:
>>example4MATLAB Plot Generated:

The plot was printed by typing 'print' at the MATLAB prompt when the plot was displayed in the graphics window.