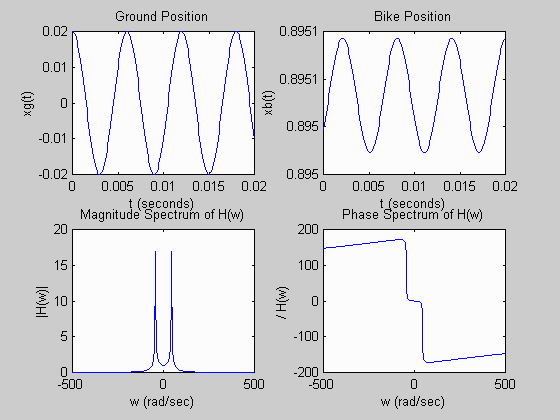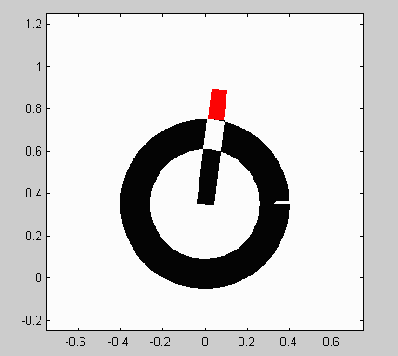

This example shows a MATLAB M-file for simulating a suspension system, animating the system, and plotting the input and output positions for a sinusoidal input.
MATLAB M-File example8.m:
%
% Filename: example8.m
%
% Description: M-file to simulate front bike suspension for sinusoidal
%              inputs.

clear; 					% clear memory and figure
clf;

d = 0.9;				% equil distance: bike-to-ground in m
m = 40;					% mass of 1/2(bike+person) in kg
b = 100;				% damping coefficient
k = 79000;				% spring coefficient
g = 9.81;				% acceleration of gravity

t   = 0:0.0001:0.02;			% define range of times
wo  = 2*pi/0.006;			% T=6ms for 4cm bump spacing at 15mph
A   = 0.02;                      	% 2cm bumps
xg  = A*cos(wo*t);			% ground position (input)

xb1 = (d - m*g/k)*ones(size(t));	% bike position due to gravity input
H = (j*b*wo+k)/(-m*wo*wo+j*b*wo+k);	% FT of impulse response
xb2 = A*abs(H)*cos(wo*t+angle(H));      % bike position due to xg input

xb = xb1 + xb2;                         % sum outputs together by linearity

%*************** Plot ground position ************************************
figure(1);

subplot(2,2,1);
plot(t,xg);
xlabel('t (seconds)')
ylabel('xg(t)')
title('Ground Position');

%*************** Plot bike position **************************************
subplot(2,2,2);
plot(t,xb);
xlabel('t (seconds)')
ylabel('xb(t)')
title('Bike Position');

%*************** Plot magnitude spectrum of H(w) *************************
w = -500:1:500;
H = (j*b*w+k)./(-m*w.*w+j*b*w+k);
subplot(2,2,3);
plot(w,abs(H));
xlabel('w (rad/sec)');
ylabel('|H(w)|');
title('Magnitude Spectrum of H(w)');

%*************** Plot phase spectrum of H(w) *****************************
subplot(2,2,4);
plot(w,angle(H)*180/pi);
xlabel('w (rad/sec)');
ylabel('/_ H(w)');
title('Phase Spectrum of H(w)');

%*************** Call drawsusp.m to animate suspension *******************
figure(2);
drawsusp(t, xg, xb);
MATLAB M-File drawsusp.m containing drawsusp() function:
function drawsusp(t, xg, xb)
%
% Filename: drawsusp.m
%
% Description: This M-file contains a function to animate the motion
%              of a bicycle suspension system.  It needs to be sent
%              the time vector t, the ground position xg, and the bike
%              position xb.

fll = 0.4;				% fixed length of lower fork
wr = 0.33;                              % wheel radius of 13"
theta = 83*pi/180;                      % fork rake angle of 83 degrees

arcstep = 1;				% angle increment (in degrees)
                                        % to sweep out arc lengths when
                                        % creating sides of wheel

lt       = length(t);			% find length of t
wheelctr = xg + wr;			% find wheel center

j = 0:arcstep:(360-arcstep);     	% create wheel sides using arclengths
arcx = wr * cos((j+arcstep) * pi/180); 	% x coordinates of wheel sides
arcy = wr * sin((j+arcstep) * pi/180); 	% y coordinates of wheel sides

				        % construct initial fork with wide line
					% LineWidth of 0.5 in normal
FL = plot([0 fll*cos(theta)], [wheelctr(1) (wheelctr(1)+fll*sin(theta))], ...
          'k', 'EraseMode', 'xor', 'LineWidth', [15.0]);
hold;

FU = plot([fll*cos(theta) (xb(1)-wheelctr(1))/tan(theta)], ...
          [(wheelctr(1)+fll*sin(theta)) xb(1)], ...
          'r', 'EraseMode', 'xor','LineWidth', [13.0]);

axis([-0.75 0.75 -0.25 1.25]);		% constuct square axes
axis('square')
					% construct initial wheel
W = plot(arcx, arcy+wheelctr(1), 'k', 'EraseMode', 'xor', 'LineWidth',[24.0]);

hold;

'Press a key to continue'

pause

for i = 2:lt,				% loop over data values

  set(FL, 'XData', [0 fll*cos(theta)]);	% change x coordinates of low fork ends
  					% change y coordinates of low fork ends
  set(FL, 'YData', [wheelctr(i) (wheelctr(i)+fll*sin(theta))]);
					% change x coordinates of hi fork ends
  set(FU, 'XData', [fll*cos(theta) (xb(i)-wheelctr(i))/tan(theta)]);
					% change y coordinates of hi fork ends
  set(FU, 'YData', [(wheelctr(i)+fll*sin(theta)) xb(i)]);
  set(W, 'XData', arcx);		% change x coordinate of wheel
  set(W, 'YData', arcy+wheelctr(i));	% change y coordinate of wheel
  drawnow;

  for j = 1:50,                   	% delay loop
    cos(j.*cos(j));
  end;
end;
MATLAB Plots Generated:

