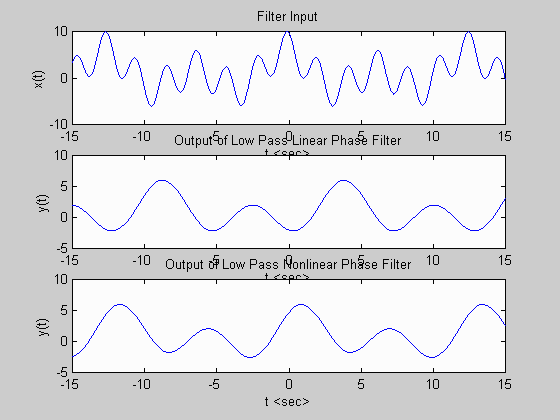
%
% Filename: example9.m
%
% Description:  M-file used for plotting the output of an ideal
%               low pass filter with linear versus nonlinear phase.
%

clear; clf;                  	% clear memory and figure

t = -15:0.01:15;                % define time values

				% filter input
x = 1 + 2*cos(t/2 + 0.1) + 3*cos(t + 0.2) + 4*cos(3*t + 0.4);
subplot(3,1,1); plot(t,x);
xlabel('t '); ylabel('x(t)'); title('Filter Input');

				% linear phase filter output
yl = 1 + 2*cos((t - 4)/2 + 0.1) + 3*cos((t - 4) + 0.2);
subplot(3,1,2); plot(t,yl)
xlabel('t '); ylabel('y(t)');
title('Output of Low Pass Linear Phase Filter');

				% nonlinar phase filter output
ynl = 1 + 2*cos((t - 2*sin(pi/4))/2 + 0.1) + ...
      3*cos((t - sin(pi/2)) + 0.2);
subplot(3,1,3); plot(t,ynl);
xlabel('t '); ylabel('y(t)');
title('Output of Low Pass Nonlinear Phase Filter');
MATLAB Plots Generated:
