EDU» dir
. deisl1.isu ghostscript matlabrc.m.bak relnotes.txt
.. extern help notebook toolbox
bin ghostscr matlabrc.m readme.txt
EDU» cd ../../temp
EDU» diary example1.txt
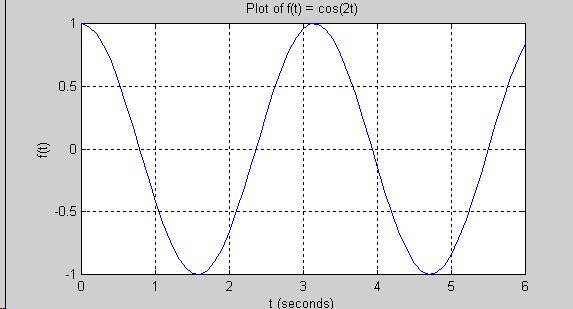
EDU» t=0:0.1:6;
EDU» f=cos(2*t);
EDU» plot(t,f);
EDU» xlabel('t (seconds)');
EDU» ylabel('f(t)');
EDU» title('Plot of f(t) = cos(2t)');
EDU» grid;
EDU» diary off
EDU»
Diary File example1.txt Created in /temp Directory:
t=0:0.1:6;
f=cos(2*t);
plot(t,f);
xlabel('t (seconds)');
ylabel('f(t)');
title('Plot of f(t) = cos(2t)');
grid;
diary off
Matlab Plot Generated:
Note that the plot can be printed by typing print at the >> prompt or
selecting File->Print from the figure window.