

%
% Filename: example8.m
%
% Description: M-file demonstrating various matlab functions
%              for system analysis.  Functions use system transfer
%              function H(s) as input.
%

clear;                      % clear matlab memory

numH = [2 5 7];             % numerator of H(s)
denH = [3 1 4 9];           % denominator of H(s)

disp(' '); disp('H(s) = '); % print H(s) to window
printsys(numH,denH,'s');

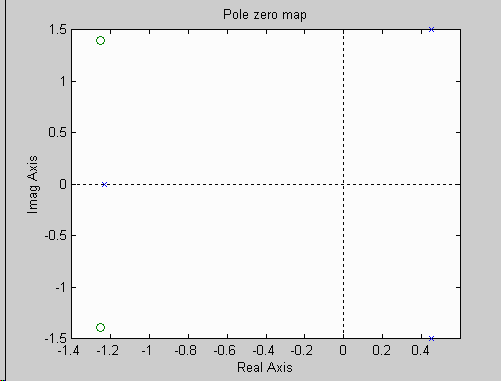
% Plot system poles and zeros
  figure(1); clf;           % put plots in figure 1
  pzmap(numH,denH);

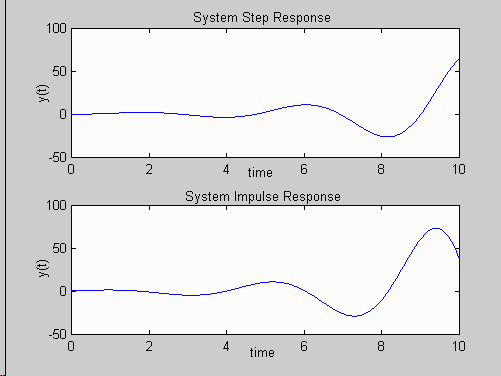
% Compute and plot step/impulse responses

  figure(2); clf;             % put plots in figure 2

  t = 0:0.01:10;
  y = step(numH,denH,t);      % compute & plot system step response
  subplot(2,1,1);
  plot(t,y);
  xlabel('time ');
  ylabel('y(t)');
  title('System Step Response');

  y = impulse(numH,denH,t);   % compute & plot impulse  response
  subplot(2,1,2);
  plot(t,y);
  xlabel('time ');
  ylabel('y(t)');
  title('System Impulse Response');

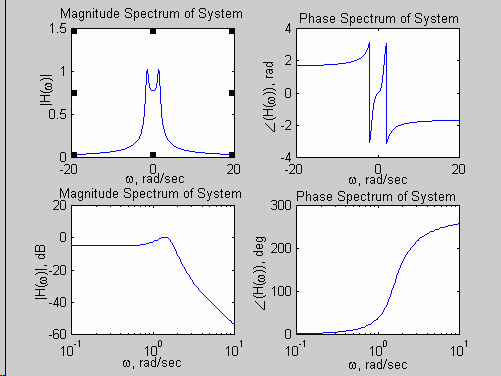
% Compute and Plot Spectra of H(w) using freqs

  figure(3); clf;           % put plots in figure 3

  w = -20:0.05:20;
  H = freqs(numH,denH,w);   % compute and plot H(w) spectra
  subplot(2,2,1);
  plot(w,abs(H));
  xlabel('\omega, rad/sec');
  ylabel('|H(\omega)|');
  title('Magnitude Spectrum of System');

  subplot(2,2,2);
  plot(w,angle(H));
  xlabel('\omega, rad/sec');
  ylabel('\angle(H(\omega)), rad ');
  title('Phase Spectrum of System');

% Compute and plot spectra of H(w) in log form using bode

  w = logspace(-1,1,100);   % w has 100 values from 10^(-1) to 10^1
                            % with same # of points in each decade

  [magH, phaseH] = bode(numH,denH,w);   % compute and plot H(w) spectra
  subplot(2,2,3);
  semilogx(w,20*log(magH));
  xlabel('\omega, rad/sec');
  ylabel('|H(\omega)|, dB ');
  title('Magnitude Spectrum of System');

  subplot(2,2,4);
  semilogx(w,phaseH);
  xlabel('\omega, rad/sec');
  ylabel('\angle(H(\omega)), deg ');
  title('Phase Spectrum of System');
Matlab Response Generated:
H(s) =

num/den =

       2 s^2 + 5 s + 7
   ----------------------
   3 s^3 +  s^2 + 4 s + 9
MATLAB Plots Generated:


