%
% Filename: example11.m
%
% Description: m-file that plots the DTFT and DFT spectra versus
% discrete-time frequency
%
figure(1); clf; % open and clear figure 1
clear; % clear matlab memory
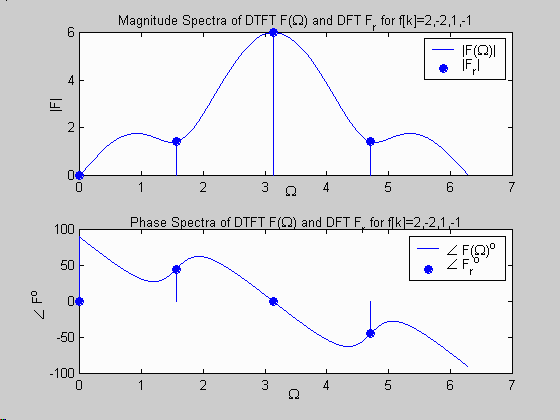
W = 0:0.001:2*pi; % define DT frequencies
F = 2-2*exp(-j*W)+exp(-j*2*W)-exp(-j*3*W);% define DTFT F(W)
r=0:3; % define DFT frequency sample numbers
Wr=r*pi/2; % define DFT frequencies
Fr=[0 1+j 6 1-j]; % define DFT Fr
subplot(2,1,1); % plot magnitude spectra
plot(W,abs(F)); hold on;
stem(Wr,abs(Fr),'filled'); hold off;
legend('|F(\Omega)|', '|F_r|');
xlabel('\Omega '); ylabel('|F|');
title('Magnitude Spectra of DTFT F(\Omega) and DFT F_r for f[k]=2,-2,1,-1');
subplot(2,1,2); % plot phase spectra
plot(W,angle(F)*180/pi); hold on;
stem(Wr,angle(Fr)*180/pi,'filled'); hold off;
legend('{\angle F(\Omega)}^o', '{\angle F_r}^o');
xlabel('\Omega '); ylabel('{\angle F}^o ');
title('Phase Spectra of DTFT F(\Omega) and DFT F_r for f[k]=2,-2,1,-1');
MATLAB Plot Generated: