

%
% Filename:  example9.m
%
% Description:  m-file to demonstrate how the DFT of a sampled analog signal
%               can be used to determine the approximate frequency content
%               (FT) of the analog signal.

% ** Use an AM signal for example **
figure(1);
clf;
clear;

fm = 20e3;
fc = 100e3;
tstep = 100e-9;
tmax  = 200e-6;
t = 0:tstep:tmax;
xam = (1 + cos(2*pi*fm*t)).*cos(2*pi*fc*t);

k = k + 1;
subplot(2,1,1);
plot(t,xam);
axis([0 200e-6 -2 2]);
grid;
xlabel('t ');
ylabel('xam(t) ');
title('AM Modulated Signal');

% Plot Frequency Spectrum of xam(t), XAM(f)
subplot(2,1,2);
stem(1000*[-120 -100 -80 80 100 120], pi*[.5 1 .5 .5 1 .5]);
grid;
xlabel('f ');
ylabel('|Xam(f)|');
title('Magnitude Spectrum of xam(t)');

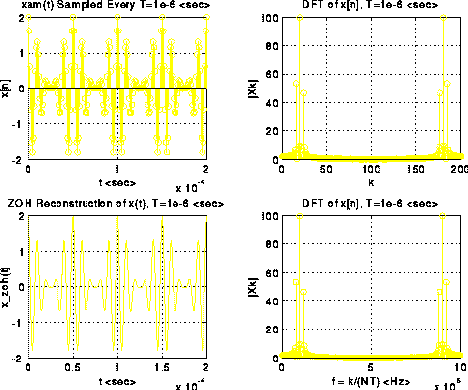
% ** Sample AM signal every 1usec **
figure(2);
clf;
clear;

fm = 20e3;
fc = 100e3;
T = 1e-6;
N = 200;
nT = 0:T:N*T;
xn = (1 + cos(2*pi*fm*nT)).*cos(2*pi*fc*nT);

% Plot Sampled Signal
subplot(2,2,1);
stem(nT,xn);
axis([0 200e-6 -2 2]);
grid;
xlabel('t ');
ylabel('x[n]');
title('xam(t) Sampled Every T=1e-6 ');

% Plot DFT of Sampled Signal Vs k
Xk = dft(xn);
k = 0:length(xn)-1;
subplot(2,2,2);
stem(k, abs(Xk));
grid;
xlabel('k');
ylabel('|Xk|');
title('DFT of x[n], T=1e-6 ');

% Plot ZOH Approximation of x(t)
subplot(2,2,3)
plot(nT, xn);
grid;
xlabel('t ');
ylabel('x_zoh(t)');
title('ZOH Reconstruction of x(t), T=1e-6 ');

% Plot DFT of Sampled Signal Vs f
Xk = dft(xn);
k = 0:length(xn)-1;
subplot(2,2,4);
stem(k/(length(xn)*T), abs(Xk));
grid;
xlabel('f = k/(NT) ');
ylabel('|Xk|');
title('DFT of x[n], T=1e-6 ');

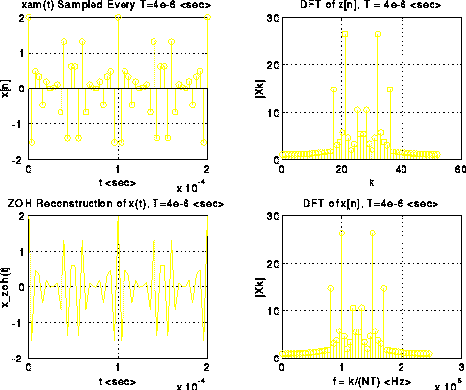
% Sample AM signal every 4usec
figure(3);
clf;
clear;

fm = 20e3;
fc = 100e3;
N = 52;
T = 4e-6;
nT = 0:T:N*T;
xn = (1 + cos(2*pi*fm*nT)).*cos(2*pi*fc*nT);

% Plot Sampled Signal
subplot(2,2,1);
stem(nT,xn);
axis([0 200e-6 -2 2]);
grid;
xlabel('t ');
ylabel('x[n]');
title('xam(t) Sampled Every T=4e-6 ');

% Plot DFT of Sampled Signal Vs k
Xk = dft(xn);
k = 0:length(xn)-1;
subplot(2,2,2);
stem(k, abs(Xk));
grid;
xlabel('k');
ylabel('|Xk|');
title('DFT of x[n], T=4e-6 ');

% Plot ZOH Approximation of x(t)
subplot(2,2,3)
plot(nT, xn);
axis([0 200e-6 -2 2]);
grid;
xlabel('t ');
ylabel('x_zoh(t)');
title('ZOH Reconstruction of x(t), T=4e-6 ');

% Plot DFT of Sampled Signal Vs f
Xk = dft(xn);
k = 0:length(xn)-1;
subplot(2,2,4);
stem(k/(length(xn)*T), abs(Xk));
grid;
xlabel('f = k/(NT) ');
ylabel('|Xk|');
title('DFT of x[n], T=4e-6 ');
MATLAB Plots Generated:


