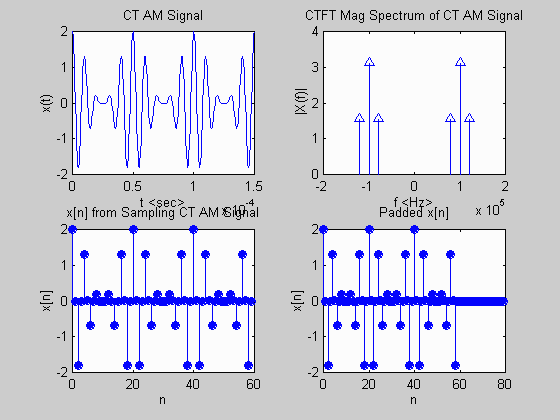

%
% Filename: example17.m
%
% Description: M-file for demonstrating the DFT approximation of
%              continous-time frequency content.
%

figure(1);
clear; clf;                      % clear memory and figure

t = 0:0.0000005:0.00015;         % CT and CT signal
x = (1 + cos(2*pi*20000*t)).*cos(2*pi*100000*t);
subplot(2,2,1); plot(t,x);
xlabel('t '); ylabel('x(t)');
title('CT AM Signal');

f = [-100000 100000 -80000 80000 -120000 120000];
X = [pi pi pi/2 pi/2 pi/2 pi/2];% CTFT mag spectrum of CT signal
subplot(2,2,2); stem(f,abs(X),'^');
xlabel('f '); ylabel('|X(f)|');
title('CTFT Mag Spectrum of CT AM Signal');

T = 0.0000025;                  % compute and plot DT signal
n = 0;
for m = 0:5:length(x)-5,
  xn(n+1) = x(m+1);
  nvec(n+1) = n;
  n = n + 1;
end;
subplot(2,2,3); stem(nvec,xn,'filled');
xlabel('n'); ylabel('x[n]');
title('x[n] from Sampling CT AM Signal');

xnpad = [xn zeros(1,20)];       % compute & plot padded DT signal
nvecpad = [nvec 60:79];
subplot(2,2,4); stem(nvecpad,xnpad,'filled');
xlabel('n'); ylabel('x[n]');
title('Padded x[n]');

figure(2); clf;                 % open & clear figure 2

Xk = dft(xnpad);                % compute and plot DFT mag spectrum
k = nvecpad;
stem(k/(80*T), abs(Xk),'filled');
xlabel('f = k/NT '); ylabel('|Xk|');
title('Magnitude Spectrum from DFT of Sampled Signal');
MATLAB Plot Generated:

