

%
% Filename:  example19.m
%
% Description:  M-file demonstrating IIR filter implemented via a
%               difference equation.
%


figure(1); clf; clear;          % clear figure and memory

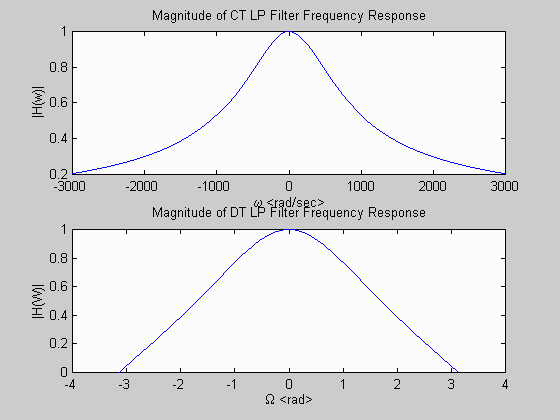
w = -3000:0.5:3000;             % CT frequency values
Hw = 628./(j*w + 628);          % compute and plot CT filter frequency response
subplot(2,1,1); plot(w,abs(Hw));
xlabel('\omega '); ylabel('|H(w)|');
title('Magnitude of CT LP Filter Frequency Response');

T = 2*pi/3000;                  % sampling interval
W = -pi:0.01:pi;                % DT frequency values
HW = 628*T*(exp(j*W)+1)./((2+628*T)*exp(j*W)-2+628*T);
subplot(2,1,2); plot(W,abs(HW));
xlabel('\Omega '); ylabel('|H(W)|');
title('Magnitude of DT LP Filter Frequency Response');


figure(2); clf; clear;          % clear figure and memory

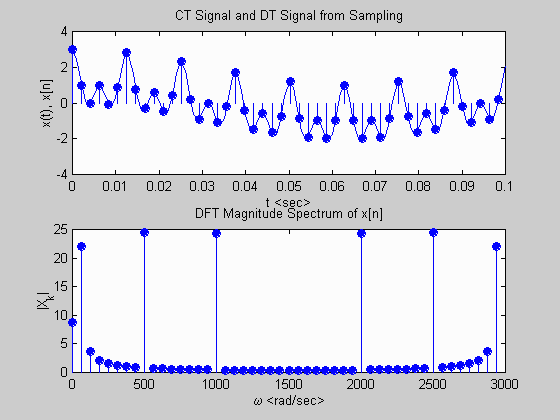
tmax = 0.1;                     % define and plot CT signal
t = 0:0.001:tmax;
x = cos(50*t) + cos(500*t) + cos(1000*t);
subplot(2,1,1);
plot(t,x); hold on;

T = 2*pi/3000;                  % sample CT signal to get DT signal
n = 0:tmax/T;                   % and then plot DT signal
xn = cos(50*n*T) + cos(500*n*T) + cos(1000*n*T);
stem(n*T,xn,'filled');
hold off;
xlabel('t '); ylabel('x(t), x[n]');
title('CT Signal and DT Signal from Sampling');

Xk = fft(xn);                   % compute and plot DFT of DT signal
subplot(2,1,2);
stem(2*pi*n/(length(Xk)*T), abs(Xk),'filled');
xlabel('\omega '); ylabel('|X_k|');
title('DFT Magnitude Spectrum of x[n]');


figure(3); clf; clear n;        % clear figure and n-variable

yprev  = 0; xprev = 0;          % initial values for recursion

for n = 0:length(xn)-1,         % begin filtering via recursion

  x = xn(n+1);
  y = -((628*T-2)/(628*T+2))*yprev + (628*T/(628*T+2))*(x + xprev);

  yprev = y;
  xprev = x;
  yvec(n+1) = y;
  nvec(n+1) = n;
end;

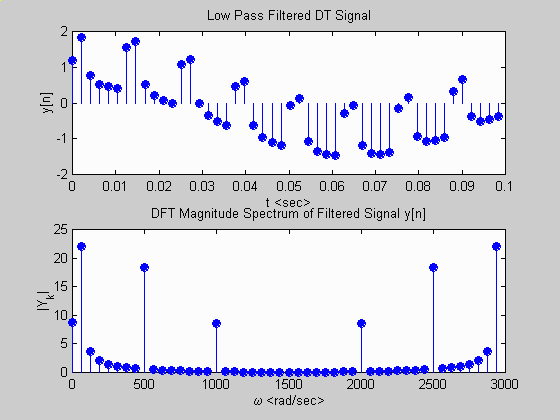
subplot(2,1,1);                 % plot filtered signal
stem(nvec*T,yvec,'filled');
xlabel('t '); ylabel('y[n]');
title('Low Pass Filtered DT Signal');

Yk = fft(yvec);
subplot(2,1,2);
stem(2*pi*nvec/(length(Yk)*T), abs(Yk),'filled');
xlabel('\omega '); ylabel('|Y_k|');
title('DFT Magnitude Spectrum of Filtered Signal y[n]');
MATLAB Plot Generated:


