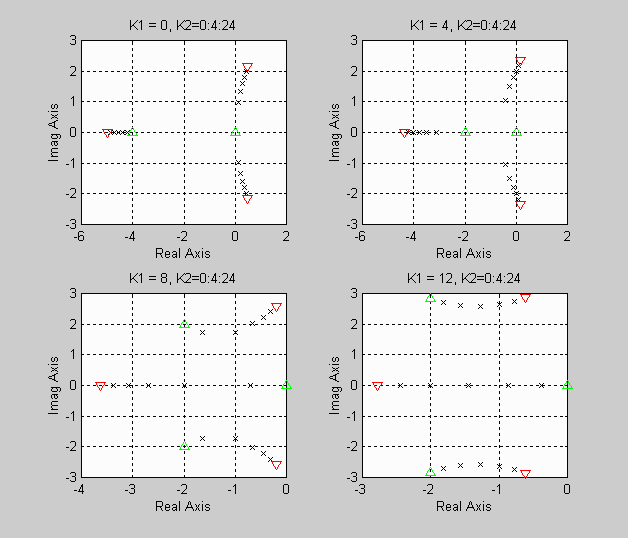
%
% Filename:  example4.m
%
% Description:  This m-file shows control system pole locations for
%               various controller gains K1 and K2.
%
clf; clear;                             % clear matlab figure and memory

n = 1;                                  % initialize denominator counter
m = 1;                                  % initialize subplot counter
for K1 = 0:4:12;                        % loop over controller gains
  for K2 = 0:4:24;
     den = [1 4 K1 K2];                 % define denominator
     poles(:,n) = roots(den);           % find poles & store in array
     n = n + 1;                         % increment denominator counter
  end;

  subplot(2,2,m);                       % plot poles using up triangle
                                        % for initial K2 and down
                                        % triangle for final K2

  plot(real(poles(:,1)), imag(poles(:,1)), 'g^');
  hold on;
  plot(real(poles(:,2:n-2)), imag(poles(:,2:n-2)), 'kx');
  plot(real(poles(:,n-1)), imag(poles(:,n-1)), 'rv');
  hold off;

  xlabel('Real Axis'); ylabel('Imag Axis'); grid;
  ttle = ['K1 = ',num2str(K1),', K2=0:4:24']; title(ttle);

  m = m + 1;                            % increment subplot counter
  n = 1;                                % reset denominator counter
end;
MATLAB Plot Generated: